A large-scale, real-life experiment
continues to be run. The "piston effect",
as described elsewhere on this website, makes it more difficult
to attain the 0.07 ppm 8-hour ozone standard compared to the
0.075 ppm standard. The piston effect indicates that as ozone
control strategies are implemented, the higher concentrations
decrease faster than the concentrations below the highest values.
In fact, the distribution of hourly ozone concentrations at the
lower level actually increase at some locations. The result of
the "piston effect" is that
as new control strategies are implemented, the states, tribes,
and the US EPA will see some progress in the reduction of hourly
average ozone concentrations at sites that experience 0.10 ppm
and above. These reductions will translate into lower 4th highest
seasonal 8-hour daily maximum concentrations. As the states,
tribes, and the EPA continue to strive for further reductions
in the 8-hour average concentrations by attempting to reduce
the hourly average concentrations below 0.09 ppm, because of
the "piston" effect, progress will begin to slow down.
The EPA, tribes, and the states may notice that the implemented
control strategies may not be working as effectively as models
originally predicted and, in some cases, governmental entities
may conclude erroneously that more stringent local controls may
be needed. In some locations, the 8-hour standard will be attained
for specific years but in other years, the 8-hour standard may
be violated at the same location. As the years go by, an oscillation
in and out of violation may occur. Please visit our concerns
web page to learn more about the piston effect and how it may
be influencing the U.S. ozone trends that have occurred over
the years. Note that a lower trending rate exists in the fourth
highest daily 8-hour ozone concentrations nationwide when compared
to a longer trending period. For example, on EPA's website (https://www.epa.gov/air-trends/ozone-trends),
the Agency in May 2024 summarized trends for the ozone periods
1980-2023, 1990-2023, 2000-2023, and 2010-2023. Note that the
national average for trends for the four time periods were 26%,
18%, 12%, and 1%, respectively.
Research reported in the literature has
described the problems in reducing hourly concentrations of ozone.
Lefohn et al. (1998) identified those sites that demonstrated
a significant reduction in ozone levels for the period 1980-1995.
Using the data from the sites that experienced reduced ozone
levels over the period of time, the authors investigated whether
the rate of decline of the mid-level hourly average concentrations
was similar to the rate experienced by the high hourly average
concentrations. The analysis indicated that there is a greater
resistance to reducing the hourly average concentrations in the
mid range than the hourly average concentrations above 0.09 ppm.
Figure 1 below is an example that shows that the higher hourly
average concentrations (i.e., above 90 ppb) decreased at a faster
rate (greater negative rate per year) than the hourly average
concentrations in the mid-level range. The numbers of hourly
average concentrations in the low end of the distribution also
decreased (i.e., the concentrations in the low end of the distribution
moved upwards). Both the high and low ends of the distribution
moved toward the center of the distribution. The upward shift
of the lower hourly average ozone concentrations is associated
with less titration of O3 by NO as reduction in NOx emissions
occur (e.g., Lefohn et al., 1998; Lefohn et al., 2010; Tørseth
et al., 2012; Simon et al., 2015; Lefohn et al., 2017, 2018;
Aas et al., 2024; Real et al., 2024). The reduction of O3 precursors
results in both the high and the low concentrations shifting
toward the mid-level values, resulting in a compression of the
distribution of hourly average concentrations.
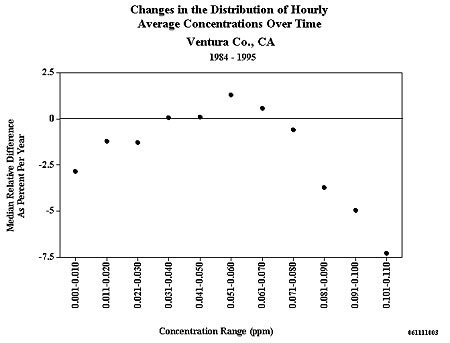
Figure 1
Lefohn et al. (1998) discussed the movement
of the low hourly average ozone concentrations toward the mid-level
values (i.e., the decrease of the frequency of the lower hourly
average concentrations). Figure 2 illustrates the frequency of
occurrence
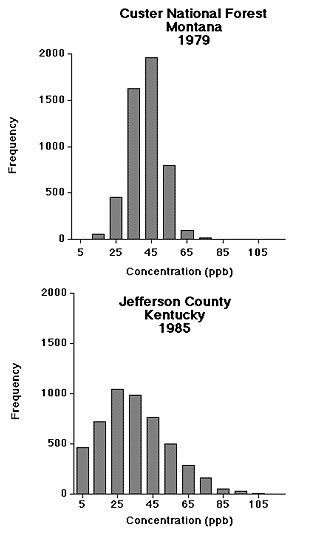
Figure 2
of hourly average ozone concentrations
at two monitoring sites. The Custer National Forest rural site
in Montana experiences very low maximum hourly average concentrations.
The distribution of the hourly average concentrations at the
site shows a lack of both high and low hourly average concentrations.
The hourly and 8-hour daily maximum concentrations above 0.05
ppm at this site may not be associated with long-range transport
of ozone and its precursors from more polluted locations. The
site experienced its highest hourly average concentrations in
April and May; this is when most sites in the United States do
not experience high hourly average average concentrations. This,
coupled with the observation that the diurnal maximum concentrations
occurred between 1400 and 1500 local time, implies that the ozone
may have been generated locally or meteorological processes are
transporting the ozone down from aloft. The sources for creating
the ozone may have been associated with natural processes (e.g.,
stratospheric intrustions).
The distribution pattern of the hourly
average concentrations for a heavily urban-influenced monitoring
site at Jefferson County, Kentucky is shown in Figure 2. In contrast
to the rural site in Montana, the urban-influenced site in Kentucky
showed frequent high and low hourly average concentrations. This
site appeared to be influenced by NOx scavenging because of the
occurrence of more frequent low hourly average concentrations.
Lefohn et al. (1998) reported in their
trends analyses, that as ozone levels improved for several urban
sites, both the high and the low hourly average concentrations
moved toward the 0.03-0.06 ppm range, which is within the range
of concentrations that most frequently occurred at the rural
site in Montana. Lefohn et al. (1998) hypothesized that as adequate
control strategies were implemented, the distribution pattern
of hourly average concentrations for inland monitoring sites
would approach the pattern observed at the Montana site and other
remote sites in the western United States.
Coyle, Fowler, and Ashmore (2003) reported
for an analysis of United Kingdom monitoring data that peak ozone
concentrations declined by about 30% over the decade of data
they analyzed, and they noted that there was evidence of an increase
in annual mean concentrations of about 0.1 ppb per year. Using
simulation modeling, the authors reported that the lower concentrations
increased. Although the authors hypothesized that this increase
may reflect the impact of global increases in background concentrations,
such is not the case. As emissions reductions occur, at many
sites there are increases
in ozone concentrations at the lower levels, which is consistent
with data obtained in both the US and Europe (Lefohn et al.,
2017; Lefohn et al., 2018). Simon et al. (2015) reported similar
results for data in the U.S. As noted above, this is mostly associated
with reduced titration of ozone by reaction with NO in response
to reductions in NOx emissions (see Lefohn et al., 2017). The
shifting of the lower concentrations toward the mid values results
in many cases with the median and annual average concentrations
increasing (see Lefohn et al., 2017).
The use of annual
average and median ozone concentrations in global modeling for
validation purposes obfuscates the validation of the models due
to the "shifting" effects associated with the reduction
of NOx scavenging. Tørseth
et al. (2012) cautioned
that the use of annual mean values is of little help for evaluating
ozone trends due to the shifting effects associated with the
low end coming up and the high end coming down of the ozone distribution.
Reduced NOx emissions will give rise to a narrower frequency
distribution of ozone. The number of both the low and the high
ozone concentrations should go down as explained above if the
NOx emissions are reduced (i.e., a compression of the distribution
of the hourly average ozone concentrations). One might assume
that emissions reductions would result in lower ozone concentrations,
but such does not occur when focusing on median and annual average
concentrations. The IPCC
AR6 Report (2021) cites published research results that indicate
that the decrease of NO emissions in specific highly polluted
areas can lead to the observed increase in surface ozone concentrations
in cities using some exposure metrics (e.g., daily average concentrations).
Brown et al. (2024) note that while seasonal cycles are important
to determine (1) average ozone concentrations, (2) seasonal changes
in ozone regime and (3) trends over time, hourly or sub-daily
resolution are key to assessing peak and duration exposure metrics
for both human health and vegetation uptake. In conclusion, care
should be taken in the use
of median and annual average ozone concentrations, as well as
other averaging metrics, as exposure indices for assessing current
and future possible ozone effects on human health and vegetation.
Further discussion of the limitation of the use of median and
annual average ozone concentrations for assessing effects on
human health and vegetation can be found in Lefohn et al. (2017),
Lefohn et al. (2018), and Lefohn (2023).
As noted above, Lefohn et al. (1998) reported
decreases in the frequency of the lowest ozone concentrations
and increases in the mid-level concentrations and believed that
the decreases in frequency at the lower concentrations were due
to reduced NOx scavenging. In addition, (as noted here
and here),
no changes have been observed in the 4th highest 8-hour concentration
at some remote and relatively remote clean national park sites
in the United States. Lefohn et al. (2017) (please see publications list for additional references)
also noted that some sites in the western US experienced no trends
in surface ozone concentrations using several exposure indices
related to human health and vegetation.
The "piston effect" is real and
it appears that the implementation of politically acceptable
control strategies may never be able to allow many violating
areas to reach attainment on a continuous basis when the
standard is lowered to lower and lower levels. Some nonattainment
areas will continue to oscillate into and out of violation. Nature
has provided us with the "piston effect" and the challenge
is how best to work with it. Our research continues on the "piston
effect".
In assessing the efficacy of air pollution
reduction programs, it is important to determine whether 1) expected
emission reductions have occurred, 2) actual emission changes
resulted in changes in ambient concentrations consistent with
the predictions of air quality models, 3) changes in ambient
concentrations have resulted in reductions in human and ecosystem
exposure (using biologically relevant exposure metrics) to the
air pollutants in question, and 4) reductions have led to improved
public health and reduced damage to sensitive ecosystems. For
ozone, if inconsistent observations are found to occur, then
it is possible that there were problems with the assumptions
used in the establishment of the protective level for the 8-hour
ozone standard. If so, it will be necessary to assess the physical,
biological, and mathematical methodologies used to develop the
ozone standard prior to reaching the simple conclusion that more
emission reductions are required. It is important to better understand
the physical, biological, and natural processes at work.
When inconsistent observations occur when
assessing the efficacy of air pollution reductions programs in
the four items listed above in the previous paragraph, the answer
may not necesarily lie in applying more stringent emission controls.
Perhaps instead the current form of the standard may have to
be replaced with a form and level that provides the protection
of human health by better focusing on those hourly average ozone
concentrations responsible for eliciting adverse health effects.
A.S.L. & Associates is actively performing research in
this area.
References
Aas, W., Fagerli, H., Alastuey,
A., Cavalli, F., Degorska, A., Feigenspan, S., Brenna, H., Gliß,
J., Heinesen, D., Hueglin, C., Holubová, A., Jaffrezo,
J.L., Mortier, A., Murovec, M., Putaud, J.P., Rüdiger, J.,
Simpson, D., Solberg, S., Tsyro, S., Tørseth, K., Yttri,
K.E., 2024. Trends in Air Pollution in Europe, 2000-2019. Aerosol
Air Qual. Res. 24, 230237. https://doi.org/10.4209/aaqr.230237.
Brown et al. 2024. Performance
evaluation of UKESM1 for surface ozone across the pan-tropics.
Atmos. Chem. Phys., 24, 12537-12555, 2024 https://doi.org/10.5194/acp-24-12537-2024.
Coyle M., Fowler, D. and
Ashmore M. (2003) New Directions: Implications of Increasing
Tropospheric Background Ozone Concentrations for Vegetation.
Atmospheric Environment. 37:153-154.
IPCC, 2021: Climate Change
2021: The Physical Science Basis. Contribution of Working Group
I to the Sixth Assessment Report of the Intergovernmental Panel
on Climate Change [Masson-Delmotte, V., P. Zhai, A. Pirani, S.
L. Connors, C. Péan, S. Berger, N. Caud, Y. Chen, L. Goldfarb,
M. I. Gomis, M. Huang, K. Leitzell, E. Lonnoy, J. B. R. Matthews,
T. K. Maycock, T. Waterfield, O. Yelekçi, R. Yu and B.
Zhou (eds.)]. Cambridge University Press.
Lefohn A. S., Shadwick
D. S. and Ziman S. D., 1998. The Difficult Challenge of Attaining
EPA's New Ozone Standard. Environmental Science & Technology.
32(11):276A-282A.
Lefohn, A. S., Shadwick,
D., Oltmans, S. J. 2010. Characterizing changes in surface ozone
levels in metropolitan and rural areas in the United States for
1980?2008 and 1994?2008. Atmos. Environ. 44 (39):5199?5210.
Lefohn, A.S., Malley, C.S.,
Simon, H., Wells. B., Xu, X., Zhang, L., Wang, T., 2017. Responses
of human health and vegetation exposure metrics to changes in
ozone concentration distributions in the European Union, United
States, and China. Atmospheric Environment 152: 123-145. doi:10.1016/j.atmosenv.2016.12.025.
Lefohn, A.S., Malley, C.S.,
Smith, L., Wells, B., Hazucha, M., Simon, H., Naik, V., Mills,
G., Schultz, M.G., Paoletti, E., De Marco, A., Xu, X., Zhang,
L., Wang, T., Neufeld, H.S., Musselman, R.C., Tarasick, T., Brauer,
M., Feng, Z., Tang, T., Kobayashi, K., Sicard, P., Solberg, S.,
and Gerosa. G., 2018. Tropospheric ozone assessment report: global
ozone metrics for climate change, human health, and crop/ecosystem
research. Elem Sci Anth. 2018;6(1):28. doi:10.1525/elementa.279.
Lefohn, A.S. 2023. Comments on the Policy
Assessment for the Reconsideration of the Ozone National Ambient
Air Quality Standards, Draft Version 2 - Docket ID No. EPA-HQ-OAR-2018-0279-0617.
The comments can be downloaded here.
Real, E., Couvidat, F., Chantreux, A.,
Megaritis, A., Valastro, G., Colette, A. 2024. Assessing the
Robustness of Ozone Chemical Regimes to Chemistry-Transport Model
Configurations. Atmosphere. 15, 532. https://doi.org/10.3390/atmos15050532.
Simon, H., Reff, A., Wells, B., Xing, J.,
Frank, N. 2015. Ozone trends across the United States over a
period of decreasing NOx and VOC emissions. Environ Sci Technol
49: 186-195. dx.doi.org/10.1021/es504514z.
Tørseth, K., Aas,
W., Breivik, K., Fjæraa, A.M., Fiebig, M., Hjellbrekke,
A.G., Lund Myhre, C., Solberg, S., and Yttri, K.E. 2012. Introduction
to the European Monitoring and Evaluation Programme (EMEP) and
observed atmospheric composition change during 1972–2009.
Atmos. Chem. Phys., 12, 5447–5481, 2012
www.atmos-chem-phys.net/12/5447/2012/doi:10.5194/acp-12-5447-2012.