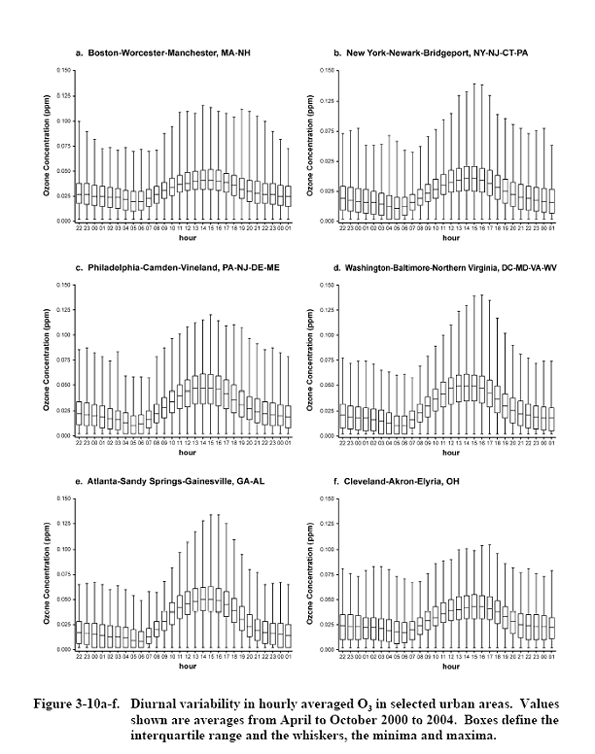
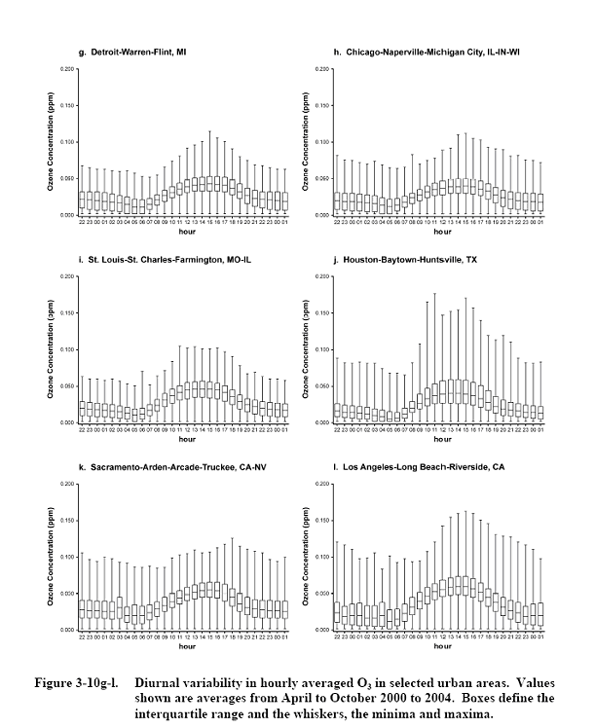
Source: U.S. Environmental
Protection Agency (2006).
Thus, based on the published literature
combined with the findings from the EPA (2006), summarized ambient
air quality data provide important evidence for those vegetation
and human health clinical researchers who are applying varying
hour-by-hour O3 concentrations (i.e., triangular exposure regimes)
in their experiments. Findings reported by Lefohn et al. (2010)
continue to indicate that square-wave O3 patterns of exposure
are fairly rare under ambient conditions. The investigators found
that if one defined a "square wave" profile as experiencing
a variable range of 4 ppb or less over an 8-hour period, then
only 1.51% of all sequences (28,148) would be classified as representing
a "square wave". Thus, the results published by Hazucha
et al. (1992) and Adams (2003; 2006) suggest that the
higher hourly average concentrations elicit a greater effect
than the lower hourly average values in a non-linear manner and
that identical 8-hour average concentrations with different combinations
of hourly values will result in different FEV1 responses.
Besides controlled human health O3 laboratory
experiments, researchers have compared effects associated with
both high-concentration intermittent and low concentration-continuous
exposures in rats applying other pollutants. Liu et al. (2022)
noted that when the total amount of PM2.5 exposure was equal,
effects were more serious when high concentration-intermittent
exposures were applied than when low concentration-continuous
exposures were used. The authors noted that
Previous toxicological studies on other
air pollutants had shown similar results, including formaldehyde
and ozone. One possible explanation for these results was that
the relationship between exposure concentrations of these pollutants
and health damage did not follow a linear relationship, but was
more like an exponential one (Zhang et al., 2018; Adams, 2003;
Adams, 2006; Hazucha and Lefohn, 2007). Therefore, the high PM2.5
concentrations experienced by rats in the intermittent exposure
group would result in greater toxicity to health even if the
total PM2.5 exposure mass was the same during the exposure period
set in this experiment.
Thus, the comparative results derived from
controlled human health O3 laboratory experiments employing high-concentration
intermittent and low concentration-continuous exposures imply
that the current form (i.e., 8-hour average) ozone standard is
not necessarily the most optimum exposure metric for assessing
human health effects associated with ozone exposure (Hazucha
and Lefohn, 2007; Lefohn et al., 2010). Lefohn et al. (2010)
discussed a possible alternative form of the current 8-hour average
standard that uses an 8-hour cumulative concentration exposure
metric.
References
Adams, W. C. (2003) Comparison of chamber
and face mask 6.6-hour exposure to 0.08 ppm ozone via square-wave
and triangular profiles on pulmonary responses. Inhalation Toxicology
15: 265-281.
Adams, W. C. (2006). Comparison of Chamber
6.6-h Exposures to 0.04 - 0.08 ppm Ozone Via Square-Wave and
Triangular Profiles on Pulmonary Responses. Inhal Toxicol. Inhalation
Toxicology 18, 127-136.
Adams, W. C.; Ollison, W. M. (1997) Effects
of prolonged simulated ambient ozone dosing patterns on human
pulmonary function and symptomatology. Presented at: 90th annual
meeting of the Air & Waste Management Association; June;
Toronto, Ontario, Canada. Pittsburgh, PA: Air & Waste Management
Association; paper no. 97-MP9.02.
Coffey, P.; Stasiuk, W.; Mohnen, V. (1977)
Ozone in rural and urban areas of New York State: part I. In:
Dimitriades, B., ed. International conference on photochemical
oxidant pollution and its control - proceedings: volume I; September
1976; Raleigh, NC. Research Triangle Park, NC: U.S. Environmental
Protection Agency, Environmental Sciences Research Laboratory;
pp. 89-96; report no. EPA-600/3-77-001a. Available from: NTIS,
Springfield, VA; PB-264232
Drechsler-Parks, D.M., Horvath, S.M., Bedi,
J.F., 1990. The ''effective dose'' concept in older adults exposed
to ozone. Experimental Gerontology 25, 107-115. https://doi.org/10.1016/0531-5565(90)90041-Y
Hazucha, M. J.; Folinsbee, L. J.; Seal,
E., Jr. (1992) Effects of steady-state and variable ozone concentration
profiles on pulmonary function. Am. Rev. Respir. Dis. 146: 1487-1493.
Hazucha, M. J.; Lefohn, A. S. (2007) Nonlinearity
in Human Health Response to Ozone: Experimental Laboratory Considerations.
Atmospheric Environment. 41:4559-4570.
Hogsett, W. E.; Tingey, D. T.; Holman,
S. R. (1985) A programmable exposure control system for determination
of the effects of pollutant exposure regimes on plant growth.
Atmospheric Environment 19: 1135-1145.
Lefohn, A. S.; Foley, J. K. (1993). Establishing
Ozone Standards to Protect Human Health and Vegetation: Exposure/Dose-Response
Considerations. J. Air Waste Manag. Assoc. 43(2):106-112.
Lefohn, A.S., Hazucha,
M.J., Shadwick, D., Adams, W.C. (2010). An Alternative Form and
Level of the Human Health Ozone Standard. Inhalation Toxicology.
22 (12):999-1011.
Lefohn, A.S., Malley, C.S.,
Smith, L., Wells, B., Hazucha, M., Simon, H., Naik, V., Mills,
G., Schultz, M.G., Paoletti, E., De Marco, A., Xu, X., Zhang,
L., Wang, T., Neufeld, H.S., Musselman, R.C., Tarasick, T., Brauer,
M., Feng, Z., Tang, T., Kobayashi, K., Sicard, P., Solberg, S.,
and Gerosa. G. (2018). Tropospheric ozone assessment report:
global ozone metrics for climate change, human health, and crop/ecosystem
research. Elem Sci Anth. 2018;6(1):28. DOI:
http://doi.org/10.1525/elementa.279.
Liu, H., Nie, H., Lai, W., Shi, Y., Liu,
X., Li, K., Tian, L., Xi, Z., Lin, B. 2022. Different exposure
modes of PM2.5 induces bronchial asthma and fibrosis in male
rats through macrophage activation and immune imbalance induced
by TIPE2 methylation. Ecotoxicology and Environmental Safety
247 (2022) https://doi.org/10.1016/j.ecoenv.2022.114200.
Mohnen, V. A.; Hogan, A.; Coffey, P. (1977)
Ozone measurements in rural areas. J. Geophys. Res. 82: 5889-5895.
Musselman, R. C.; Oshima, R. J.; Gallavan,
R. E. (1983) Significance of pollutant concentration distribution
in the response of `red kidney' beans to ozone. J. Am. Soc. Hortic.
Sci. 108: 347-351.
Reiter, E. R. (1977a) Review and analysis.
In: Mohnen, V. A.; Reiter, E. R., eds. International conference
on oxidants, 1976 - analysis of evidence and viewpoints; part
III. the issue of stratospheric ozone intrusion. Research Triangle
Park, NC: U.S. Environmental Protection Agency, Environmental
Sciences Research Laboratory; pp. 67-117; report no. EPA-600/3-77-115.
Available from: NTIS, Springfield, VA; PB-279010.
Rombout, P. J. A., Lioy, P. J.; Goldstein,
B. D. (1986). Rationale for an eight-hour ozone standard. J.
Air Pollut. Control Assoc. Vol. 36, no. 8, pp. 913-917.
Silverman, F., Folinsbee,
L.J., Barnard, J.W., Shephard, R.J. 1976. Pulmonary Function
Changes in Ozone -- Interaction of Concentration and Ventilation.
J Appl Physiol 41/6:859-864. https://doi.org/10.1152/jappl.1976.41.6.859
U.S. Environmental
Protection Agency (2006) Air Quality Criteria for Ozone and Related
Photochemical Oxidants. Research Triangle Park, NC: Office of
Research and Development; report no. EPA/600/R-05/004af.
Zhang, X., Zhao,
Y., Song, J., Yang, X., Zhang, J.F., Zhang, Y.P., Li, R., 2018.
Differential health effects of constant versus intermittent exposure
to formaldehyde in mice: implications for building ventilation
strategies. Environ. Sci. Technol. 52,
1551–1560.


