In 1994, Drs. Allen S. Lefohn and Paul
J. Lioy, who published extensively in the peer-review literature
on exposure-response, described in a New
Directions Column, in the distinguished journal Atmospheric
Environment, their concerns about the form of the 8-hour
ozone standard. One of the several concerns mentioned was the
use of averaging to develop a standard to protect vegetation.
The concerns are real and important. In addition, the "piston" effect," as described
elsewhere on this website, may make it difficult to attain the
8-hour ozone standard at specific levels of protection.
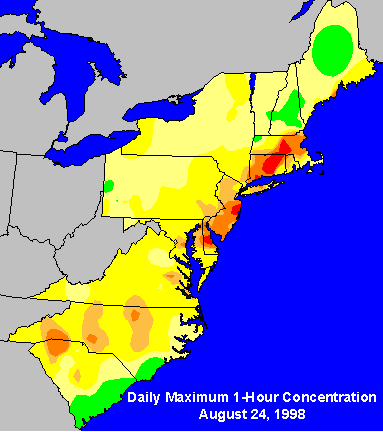
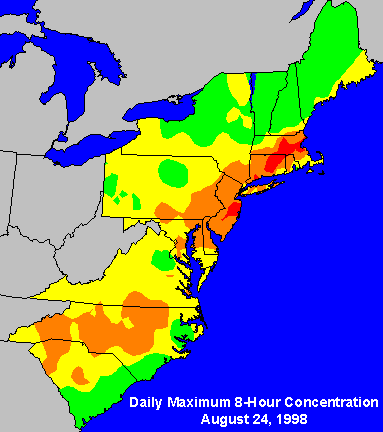
The figures below show the effect of using
8-hour averages to describe ozone exposure.


Both figures summarize the ozone data that
were collected on August 24, 1998. The figure on the right identifies
many more areas of concern than the figure on the left. The hourly
average ozone concentrations are the same in the two figures.
The difference is that the figure on the right averaged the hourly
concentrations over an 8-hour period, while the figure on the
left shows the maximum hourly value for the day. By applying
8-hour averages, the data are smoothed and provide the appearence
of greater areas of concern, which may not necessarily be accurate.
Clinical health laboratory studies provide evidence that peak
hourly concentrations are more important than extended-period
average concentrations (see Lefohn et al., 2018-Section 2). Thus,
the figure on the right (i.e., daily maximum 8-hour concentration)
may not be as relevant as the figure on the left (i.e., daily
maximum 1-hour concentration). The figure on the right applies
the 8-hour average concentration exposure metric similar in a
manner that the 8-hour ozone standard is determined.
Some scientists and engineers are aware
that the United States 8-hour ozone standard may present a problem
that is referred to as "unattainability" if the standard
is set at low levels. Non trivial amounts of naturally occurring
ozone concentrations contribute to the ambient levels observed.
We discussed this in our peer-review paper
published in 1997. In November 1998, the topic was discussed
at an international meeting in Beijing, China. Over the years,
policymakers have found that the 8-hour ozone standard has become
more difficult to attain as the 8-hour standard is lowered. Control
strategies have not work as envisioned. As the highest hourly
average concentrations are reduced as a result of emissions controls,
the remaining portions of the higher end of the distribution
of hourly average concentrations decline slower than the previously
highest values and make it more difficult to attain the 8-hour
standards. Independent analyses have confirmed the "piston
effect." EPA reports and papers published in 1985, 1995,
and 1996 confirm the effect. Lefohn et al. (2017) illustrated
the potential for the "piston effect" for some of the
ozone monitoring sites in the EU. A slide
presentation summarizing the "piston effect" is
available. More detailed information about the effect can be
found by clicking here.
On
EPA's website (https://www.epa.gov/air-trends/ozone-trends),
the Agency in February 2026 summarized trends for the ozone periods
1980-2024, 1990-2024, 2000-2024, and 2010-2024, respectively.
Note that the national average for trends for the four time periods
were 29%, 24%, 18%, and 7%, respectively. Clearly, the trend
pattern is slowing down. In some cases, the regional trends are
increasing.
The "piston effect" makes it difficult to attain
the 8-hour standard for some sites. The
"piston effect" as described in the peer-review literature
and on this website affects the ability
of the nation to atttain the 8-hour ozone standard at many sites.
The peak hourly average concentrations (i.e., hourly average
concentrations greater than or equal to 0.10 ppm) are reduced
much faster than the mid-level concentrations (i.e., 0.06-0.099
ppm).
What is the cause
of the "piston effect"? Research appears to point to
the possibility that natural processes are partly responsibile
for the effect. Possible reasons for it have been discussed in
the literature (Reynolds et al., 2003; Reynolds et
al., 2004). The authors noted that when anthropogenic VOC
and NOx emissions are reduced significantly, the primary sources
of O3 precursors are biogenic emissions and CO from anthropogenic
sources. Chemical process analysis results indicated that a slowly
reacting pollutant such as CO could be contributing on the order
of 10 to 20% of the O3 produced.
There are other
reasons for the "piston effect". For example, Lefohn
et al. (2010) reported, using multisite data from 12 metropolitan
cities, that as the frequency of higher hourly average concentrations
was reduced, the lower hourly average concentrations also moved
upward toward the mid-level values. The change in the number
of the hourly average concentrations in the lower range was consistent
with decreased NO scavenging. Simon et al. (2015) reported similar
results using data from a larger number of sites in the U.S.
Our research continues on this very important subject.
Is there a way to
get around the "piston effect." Probably not. We must
realize its existence and deal with it in implementing our national
ozone standards. If we do not, then it is possible that future
8-hour ozone standards, as they are lowered, may become a "goal"
instead of an attainable regulation. Therefore, as the 8-hour
ozone standard continues to be lowered, there will be a level
at which the result of further emissions reductions may not yield
attainability because of the "piston effect." To learn
more about the "piston effect", please click
here.
References
Lefohn, A.S., Shadwick,
D., Oltmans, S.J. (2010). Characterizing Changes of Surface Ozone
Levels in Metropolitan and Rural Areas in the United States for
1980-2008 and 1994-2008. Atmospheric Environment. 44:5199-5210.
Lefohn, A.S., Malley, C.S.,
Simon, H., Wells. B., Xu, X., Zhang, L., Wang, T. (2017). Responses
of human health and vegetation exposure metrics to changes in
ozone concentration distributions in the European Union, United
States, and China. Atmospheric Environment 152: 123-145. doi:10.1016/j.atmosenv.2016.12.025.
Lefohn, A.S., Malley, C.S.,
Smith, L., Wells, B., Hazucha, M., Simon, H., Naik, V., Mills,
G., Schultz, M.G., Paoletti, E., De Marco, A., Xu, X., Zhang,
L., Wang, T., Neufeld, H.S., Musselman, R.C., Tarasick, T., Brauer,
M., Feng, Z., Tang, T., Kobayashi, K., Sicard, P., Solberg, S.,
and Gerosa. G. (2018). Tropospheric ozone assessment report:
global ozone metrics for climate change, human health, and crop/ecosystem
research. Elem Sci Anth. 2018;6(1):28. DOI:
http://doi.org/10.1525/elementa.279.
Reynolds, S. D.; Blanchard, C. L.; Ziman,
S. D. (2003). Understanding the effectiveness of precursor reductions
in lowering 8-hr ozone concentrations. J. Air & Waste Manage.
Assoc. 53: 195-205.
Reynolds, S. D.; Blanchard, C. L.; Ziman,
S. D. (2004). Understanding the effectiveness of precursor reductions
in lowering 8-hr ozone concentrations - Part II. The Eastern
United States. J. Air & Waste Manage. Assoc. 54: 1452-1470.
Simon, H., Reff, A., Wells, B., Xing, J.,
Frank, N. (2015). Ozone trends across the United States over
a period of decreasing NOx and VOC emissions. Environ Sci Technol
49: 186-195. dx.doi.org/10.1021/es504514z.